Your information was successfully submitted.
Study Explanation
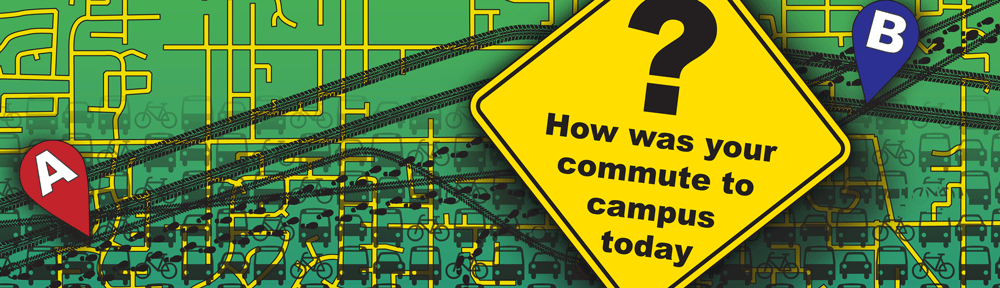
Many people who drive say they might take the bus if service in their neighbourhood was better. It is hoped that this survey will help us figure out how true that is. And if it is, mapping the results should tell us which neighbourhoods need service improvements the most.
The idea is to see how long it takes to ride the buses compared to driving a car, then see where the differences are biggest. Is there a consistent and predictable pattern between this travel time difference and how many people drive? That’s what this study is trying to find out.
Background Research Summary
A common complaint about public transit is that it takes longer than driving. It is argued that this makes driving more time efficient – that it is inefficient to use public transit. What is not known for certain is whether, for students commuting to Kwantlen Polytechnic University (KPU) campuses, the rate of public transit use varies with its degree of (in)efficiency.
There appears to be good reason to feel that public transit in communities south of the Fraser River is relatively more inefficient than other areas of the Metro Vancouver region (Todd, 2010). Kwantlen Student Association (KSA) demonstrated this in 2010 by holding a race between people running, cycling and riding the buses. They raced from Surrey campus to Langley. The transit rider arrived last (Vancouver Sun, 2010). To address this problem, KPU partnered with the KSA to offer a shuttle service between campuses.
Additional time spent traveling by public transit may be a deterrent for people who are able to find alternatives (El-Geneidy, 2009). In other regions, it seems that areas where there are very large differences in travel time compared to driving, fewer people use public transit (Vincent, Keyes, & Reed, 1994; Santos, et al, 2011). But not everyone has this flexibility. The cost of finding transportation alternatives to public transit can be prohibitively expensive for people with lower incomes (TRB, 2009). This creates an access barrier, which can be socially and economically limiting (Battelle, 2000).
Research Objectives
There are no current statistics available to infer the rate of public transit use by KPU students or the conditions of their transportation choices. This kind of data would make it easier to explain to local governments exactly how public transit could be improved for students. The intention of this study is to contribute to an analysis of student travel patterns, the characteristics of their options, and the correlation between their perceptions of those characteristics and their choices.
It is expected that, as trips by public transit become more inefficient, students participating in this study will be more likely to drive. Plotting the data on a map is expected to identify areas within the region that have both highly inefficient public transit service and low ridership.
References
Battelle. (2000). Travel Patterns of People of Color. Washington DC: U.S. Department of Transportation, Federal Highway Administration. Retrieved from http://www.fhwa.dot.gov/ohim/trvpatns.pdf
El-Geneidy. (2009). Pedestrian access to transit: Identifying redundancies and gaps using a variable service area analysis. Retrieved from http://tram.mcgill.ca/Research/Publications/Transit_service_area.pdf
KSA Kwantlen Student Association. (2012). KSA MultiPass. Retrieved from http://ksamultipass.ca/
Santos, A., et al. (2011). Summary of Travel Trends: 2009 National Household Travel Survey. (Report No. FHWA-PL-ll-022). Washington DC: U.S. Department of Transportation, Federal Highway Administration. Retrieved from http://nhts.ornl.gov/2009/pub/stt.pdf
Todd, M. (2010). Public Transit Service Areas in Metro Vancouver [Map]. Retrieved from http://matttodd.ca/docs/TRANSLINKmap-21june2010vii.pdf
TRB. (2009). Critical Issues in Transportation: 2009 Update. Washington DC: Transportation Research Board, National Research Council. Retrieved from http://onlinepubs.trb.org/Onlinepubs/general/CriticalIssues09.pdf
Vancouver Sun. (2010, September 3). Runner beats bus from campus to campus: Running from Surrey to Langley is faster than taking the bus. Retrieved from http://www.canada.com/story_print.html?id=bc2683f0-ac79-49a9-bf05-405ad0e21232&sponsor=
Vincent, M.J., Keyes, M.A., & Reed, M. (1994). NPTS Urban Travel Patterns: 1990 Nationwide Personal Transportation Survey (NPTS). (Report No. FHWA-PL-94-018). Washington DC: Office of Highway Information Management, Federal Highway Administration. Retrieved from http://nhts.ornl.gov/1990/doc/urban.pdf